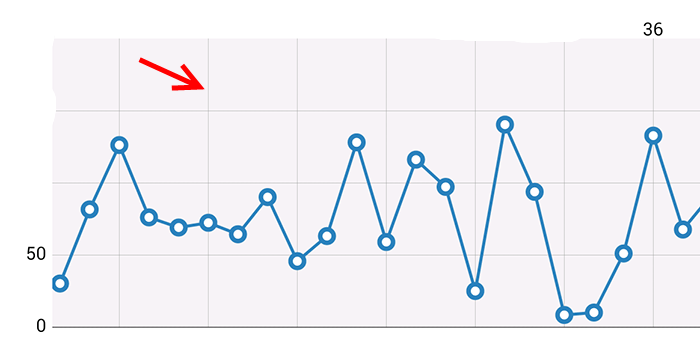
In this lesson we show to finalize the graph we just made.
First of all with the “getData()” function, get all your data e put into one/or more variables, than add one/or more parameters for every day of the week you putted in:
	int[][] datas = getData();	 	// calls a user created function tha gets all the data from source
	int[] d= datas [0];
	yAx2.add(new Entry(d[0],0)); 		// it requires a new Entry, Entry requires a numeric value, and for 2th argument an Integer index
	yAx2.add(new Entry(d[1],1));
	yAx2.add(new Entry(d[2],2));
	yAx2.add(new Entry(d[3],3));
	yAx2.add(new Entry(d[4],4));
	yAx2.add(new Entry(d[5],5));
	yAx2.add(new Entry(d[6],6));
Than activate the zoom and scroll, you can even set move limits for its Axis and other stuff.
	lc.setVisibleXRangeMaximum(65f);					//Sets the max visible field on the x Axis
        lc.setVisibleYRangeMaximum(50, YAxis.AxisDependency.LEFT);		//Sets the max visible field on the y Axis
        lc.setTouchEnabled(true);						//Activates the touch Control
        lc.setDragEnabled(true);						//Enables dragging
        lc.getAxisLeft().setAxisMinValue(0);					//Set minimum axis Zoom level
        lc.getAxisLeft().setAxisMaxValue(50);					//Set maximum axis Zoom level
        lc.setScaleMinima(0, 1);						//Set the graph total scale, from min to max

And… we have so easely made our graph!
