The PT100 and PT1000 are standard industrial temperature sensors (RTD = Resistance Temperature Detectors) that can easily be used with an Ltouch43 and Ltouch7GS by adding a 4-20mA transmitter that converts the measured resistance into a 4-20mA signal.

The PT100 sensor comes with 2, 3, or 4 wires. 2 wires give us the resistance of the sensor PLUS the leads, so we can’t be sure about the exact sensor resistance. 3 wires solve this by adding a wire to one side, so we can measure also the resistance of 1 lead wire, and assume the other one is similar. 4 wires allow us to measure the resistance of both lead wires. More details here.

A common way to use the PT100 is to add a transmiter, that converts the resistance into a 4-20mA signal. Such current loop is stable over long cable lengths. In this example we use a K109PT transmitter which can handle 2,3,4 wire PT100 sensors, and has programmable ranges and error handling.

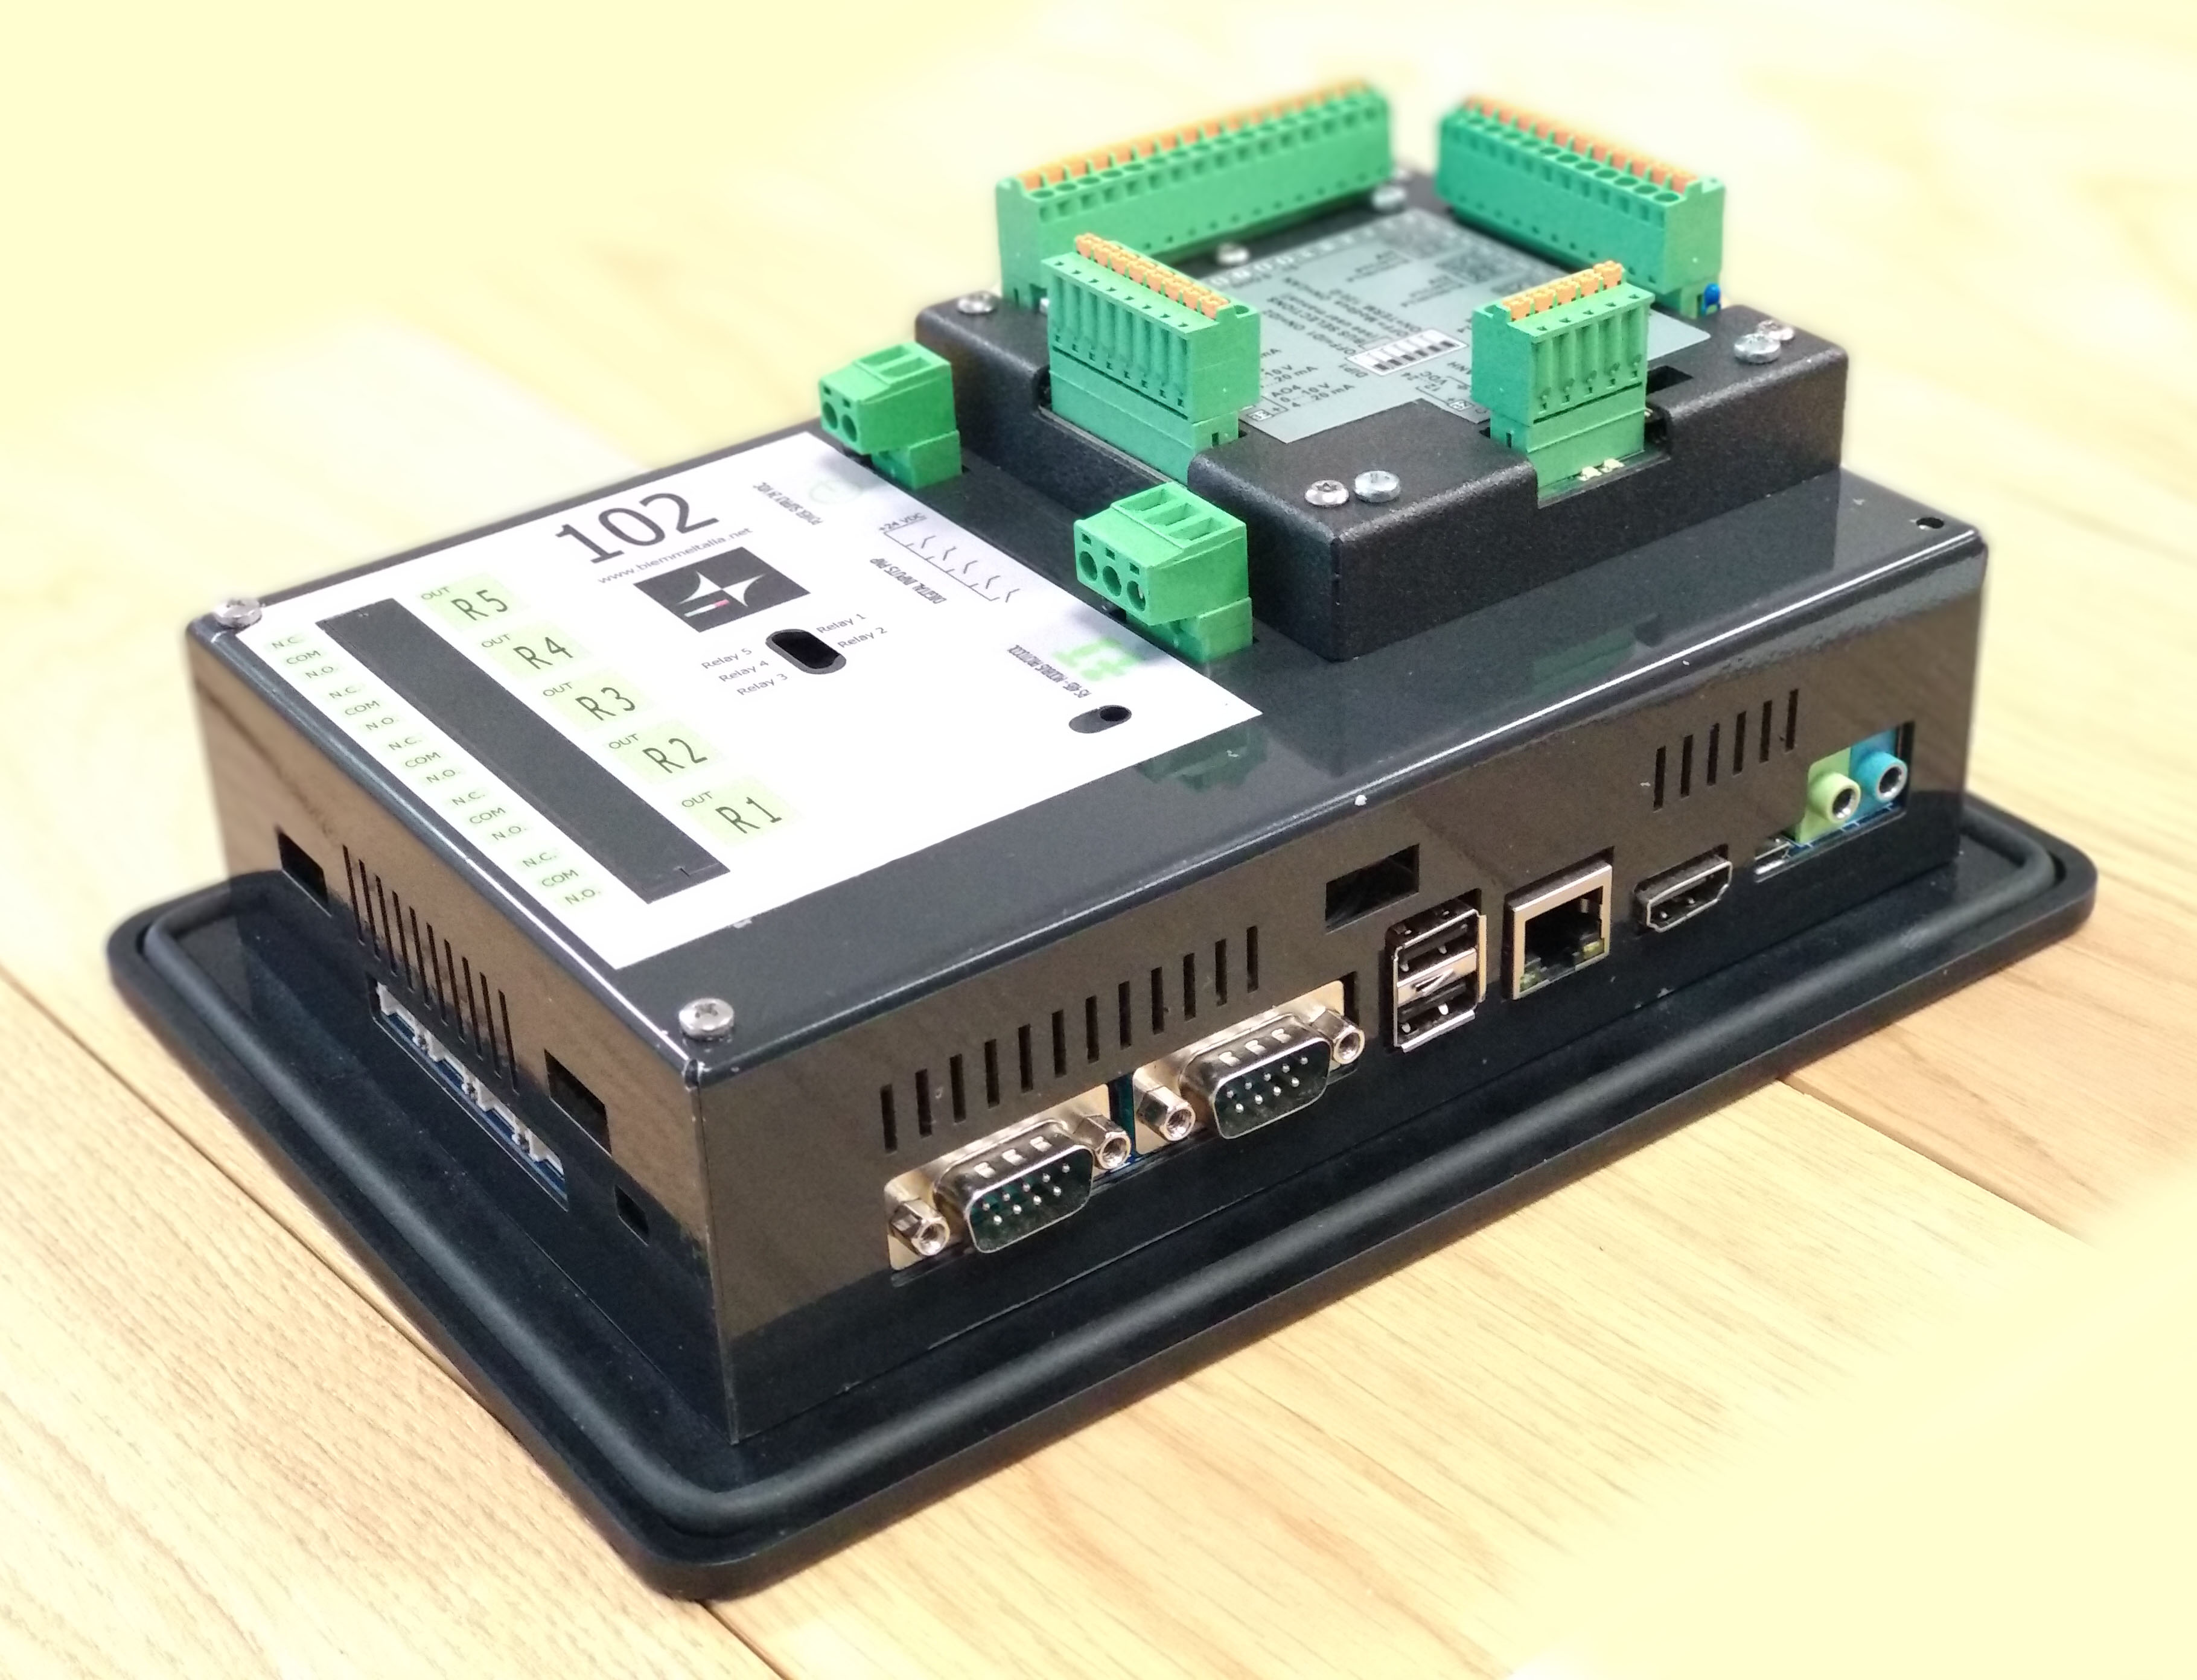
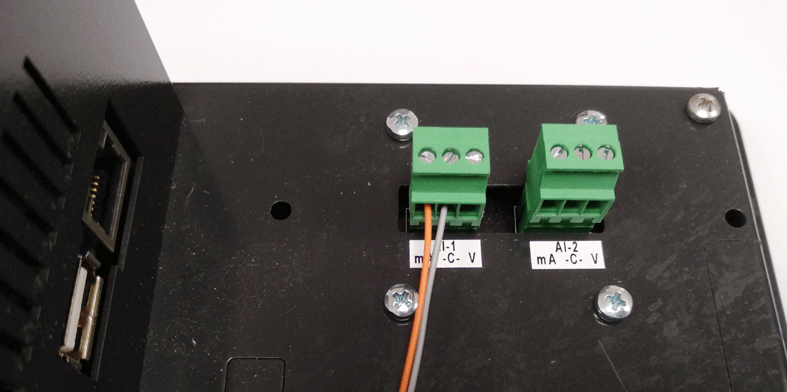
The Ltouch7 GS has 2 analog input channels, we can connect up to 2 PT100 sensors. In below example we connect 1.

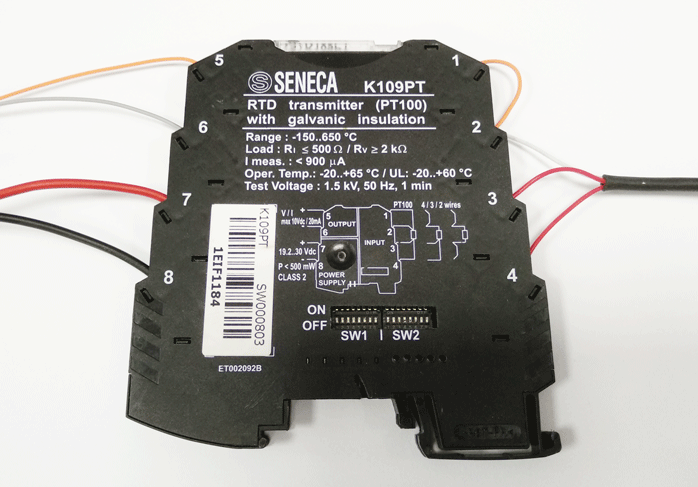
This is a close-up of our transmitter:

  • PT100 connected with 3 wires, on terminals 2, 3, 4 as per Seneca datasheet. the sensor resistance is between terminal 2 and 3 (red and white wires)
  • The converter needs a separate power supply and we connect the 24Vdc to terminals 7 and 8
  • We connect the current signal coming out of the K109PT board to the analog input of our Ltouch7 GS. We must respect the polarity and so we connect the gray wire to the GND terminal of the Ltouch.
  • The orange wire must be connected to the current mA terminal of the Ltouch
Finally, the code for this setup is very simple. The following diagram measures the 0-20mA signals on channel 1, with a resolution of 17 bits, and maps the current over a temperature range. This mapping will depend on the transmitter, the example below maps from 0 mA to 0 degrees and from 20 mA to 100 degrees (constants defined by the dip switches).
Now let’s move on to the code part for the APP:

You can use the library BMTouch to configure and read the values in to android studio.

View this for download library 

View this for how to use BMtouch Library

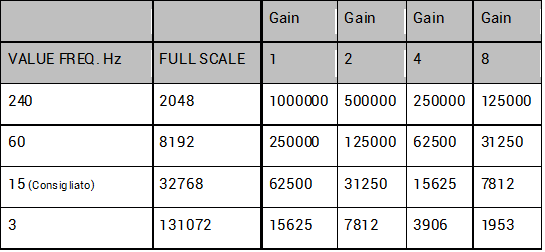
To configure the sampling frequency directly write the value of the frequency and scale through the library subito dopo protected void onCreate :

BMTouch.ADC_set_scale((byte) 0, (byte) 0, 1);

BMTouch.ADC_set_frequency((byte) 0, 15);

Now we can call the library function to read the analog value through a single call or by creating a TimerTask that executes this cyclically :

ch1_val = BMTouch.ADC_read_channel((byte) 0, (byte)0);

ch1_val returns the value read from 0 to 32768, it’s up to us to multiply it by 100 and divide by 32768 to find the temperature.

temp = (ch1_val*100)/32768;

that’s all, if you have any questions please contact us
New Ltouch7 Plus

Coming soon a new black HMI touch screen panel with Android operating system with inputs and outputs on board.
16 digital inputs / outputs, 4 configurable analog inputs with 16bit resolution, 4 analog outputs 0..10V / 4..20mA.
Display HD 7 “capacitive resolution 1028×800 IP56.

Quad core A9 dinamyc frequency scaling from 400 to 1.4G Hz.

A new native library dedicated to manage the inputs and outputs.

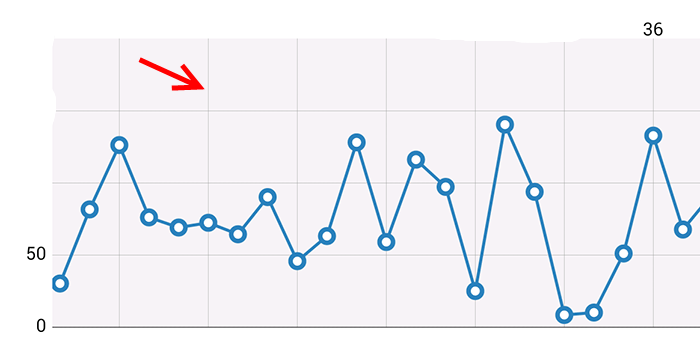
HOW TO MAKE A GRAPH USING ANDROID STUDIO AND THE PLTOUCH – (Part 3) Finalization

In this lesson we show to finalize the graph we just made.

First of all with the “getData()” function, get all your data e put into one/or more variables, than add one/or more parameters for every day of the week you putted in:


	int[][] datas = getData();	 	// calls a user created function tha gets all the data from source
	int[] d= datas [0];
	yAx2.add(new Entry(d[0],0)); 		// it requires a new Entry, Entry requires a numeric value, and for 2th argument an Integer index
	yAx2.add(new Entry(d[1],1));
	yAx2.add(new Entry(d[2],2));
	yAx2.add(new Entry(d[3],3));
	yAx2.add(new Entry(d[4],4));
	yAx2.add(new Entry(d[5],5));
	yAx2.add(new Entry(d[6],6));

Than activate the zoom and scroll, you can even set move limits for its Axis and other stuff.


	lc.setVisibleXRangeMaximum(65f);					//Sets the max visible field on the x Axis
        lc.setVisibleYRangeMaximum(50, YAxis.AxisDependency.LEFT);		//Sets the max visible field on the y Axis
        lc.setTouchEnabled(true);						//Activates the touch Control
        lc.setDragEnabled(true);						//Enables dragging
        lc.getAxisLeft().setAxisMinValue(0);					//Set minimum axis Zoom level
        lc.getAxisLeft().setAxisMaxValue(50);					//Set maximum axis Zoom level
        lc.setScaleMinima(0, 1);						//Set the graph total scale, from min to max

And… we have so easely made our graph!

HOW TO MAKE A GRAPH USING ANDROID STUDIO AND THE PLTOUCH – (Part 1) Initiation

In this example we are going to show you how to create a Graph with Android studio on our PlTouch devices. To make the graph, we need to use an external library called MpAndroidChart, that you can find here, otherwise without downloading it, you can include into the grade build file in the next stage.

This Article divides into 3 posts, Initiation, Data Setup, Finalization.

Fist of all, open one of your projects or create a new one, keeping in mind that you can put the graph itself on a specific Activity or you can directly call it under Main Activity.

If you want to import the Library by downloading it, and you don’t know how to import it in Android Studio, here’s a tutorial that fits your need, otherwise,

just follow the build gradle procedure:

LINKING BY BUILD GRADLE:
Go to your gradle.build file and paste in the following lines of code, be aware to put those outside application.

<code>
repositories {
 maven { url 'https://jitpack.io' }
}

dependencies {
 compile fileTree(include: ['*.jar'], dir: 'libs')
 androidTestCompile('com.android.support.test.espresso:espresso-core:2.2.2', {
 exclude group: 'com.android.support', module: 'support-annotations'
 })
 compile 'com.github.PhilJay:MPAndroidChart:v2.2.4'
 compile 'com.android.support:appcompat-v7:25.3.1'
 compile 'com.android.support:design:25.3.1'
 compile 'com.android.support.constraint:constraint-layout:1.0.2'
 testCompile 'junit:junit:4.12'
}

</code>

Fine, now the libray that will allow you to make the graph, has included into the project!
In the next post we are going to see how to initiate every Component correctly, stay tuned.

HOW TO MAKE A GRAPH USING ANDROID STUDIO AND THE PLTOUCH – (Part 2) Data Setup

First thing, we need to put the graph into the layou.xml file, to do this, search in the layout designer the lineChart tag, and put it in, or just type it by hand into the xml file.

At this point we need to declare some variables, that will allow us to communicate with other inner elements of Plugin/Library:


    LineChart lc; 				//lineChart Main Component
    ArrayList<String> xAx2;			//xAxis titles Array
    ArrayList<Entry> yAx2;			//yAx entry Array (Values associated with an index)
    ArrayList<ILineDataSet> dss;		//multidimensional Array containing the whole DataSet
    LineDataSet lds;			//the DataSet Component


Than we are going to Initiate every component, in your Activity on the onCreate method:


    lc = (LineChart) findViewById(R.id.lnCH1);		//xml layout Id Reference
    dss = new ArrayList<>();				//Initiate the DataSet Component as an empty Array
    xAx2 = new ArrayList<>();				//Initiate xAxis titles as an empty Array
    yAx2 = new ArrayList<>();				//Initiate yAxis values as an empty Array

After that, we need need to put our data unto the graph, to do this, first of all, we decide how to save the datas that are going to be put to the graph.
– WITH TEXT FILES Go to Tutorial
– WITH DATABASE/S

After created our Data Save System, and after instatiation, and after you have check some statement on your code, create a function to load the saved data, and in this example
we call that function “getData()”

Add to the ArrayList every day of the week, this data are going to be put to the graph like titles.


        xAx2.add("LUNEDI");		//It only adds a string parameter to the xAxis of the Graph as a Title
        xAx2.add("MARTEDI");
        xAx2.add("MERCOLEDI");
        xAx2.add("GIOVEDI");
        xAx2.add("VENERDI");
        xAx2.add("SABATO");
        xAx2.add("DOMENICA");

In the next post we are going to see how put some values to the graph, and complete the configuration, stay tuned.

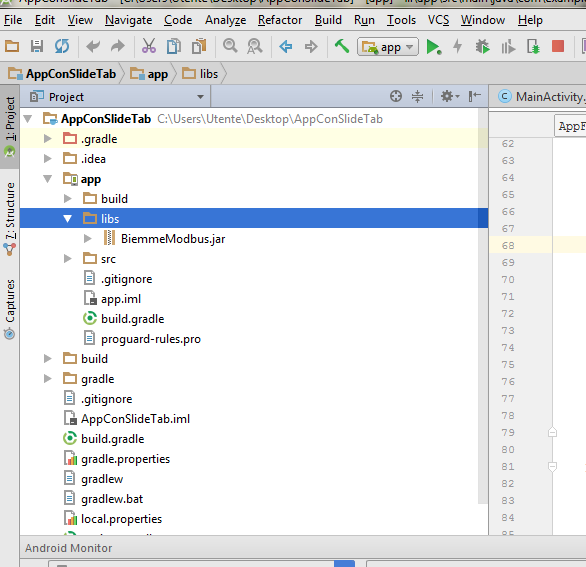
Add a custom Library, on Android Studio

In this example we are going to show you, how to import a Custom Library on Android Studio.

First of all, open one of you projects or create a new one.

Click on the DropDown menu that you find on the left-top corner of the screen, under the File Menu, scroll options until you find the word Project and click it.

Copy your Library with a Jar format in the Lib folder, that you can find at ProjectName/App/Lib

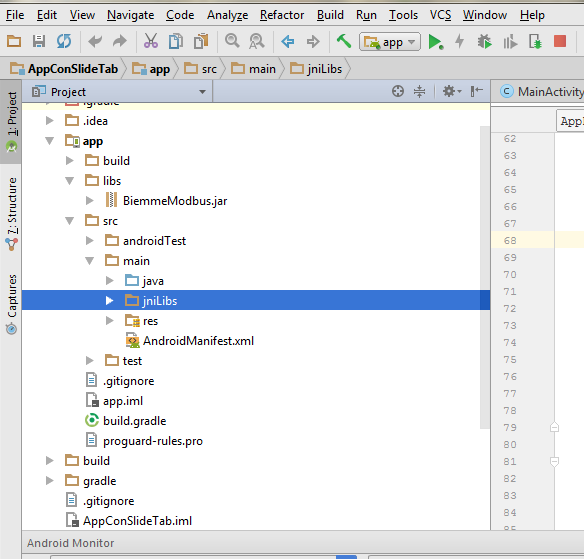
If you have .so files associated to the Library, you have to copy those under the JniLib folder, if it doesn’t exist you have to create it, precisely on the path ProjectName/App/Src/Main

immagine1

Select the Librart that you just imported on the Lib folder by left clicking and click on “Add as Library!”

immagine1

so the import, has just been completed.

Delayed timer at Insertion – ANDROID TIMER

In the industrial World, and in domotics one of the needs that you can find, is how to generate an Event after sometime Interval that you fixed .
In this simple blog we want show you, in a few simple rows of code, a Timer delayed in this insertion using Android Timers and in detail, Executors.

We are using in this case out pLtouch 101g, so you can make your idea real.
Suppose we want to activate a Relè exit after some time T from the presence of a digital input.

All that we need is a method name ScheduledExecutorService; please read this Executors tutorial

int TimeValue = 5; / 5 second of delay for active output
if (pManager.digitalRead(0) == DigitalValues.HIGH) { // if input is HIGH
ScheduledExecutorService scheduledExecutorService = Executors.newScheduledThreadPool(5);

ScheduledFuture scheduledFuture = scheduledExecutorService.schedule(new Callable() {
	public Object call() throws Exception {
	     pManager.digitalWrite(1,DigitalValues.HIGH); //delay Time TimeValue and active output
	     return "Called!";
			}
		},
	TimeValue,TimeUnit.SECONDS); // TimeValue is time of delay - TimeUnit.SECONDS is time scale Second

	} else{
	   pManager.digitalWrite(1,DigitalValues.LOW); // if input is LOW then switch off output

	}

In our case using the pLtouch 101g we are using the library for the acquisition of digital inputs, e when something present on input the Timer counts 5 seconds(TimeValue)
after that i activates the first Relè exit
When the Input stops coming, i set the Output to zero